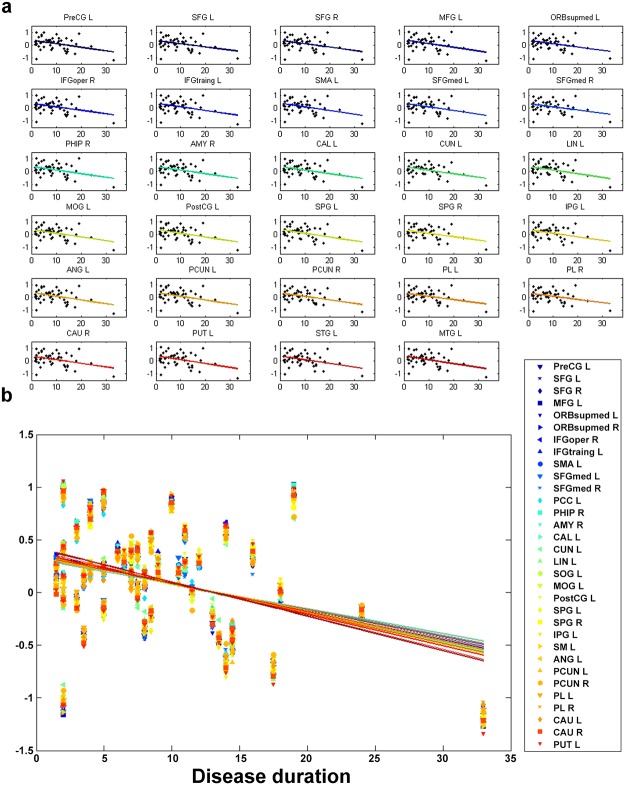
Fig 7. The progression rates of cortical atrophy in the supratentorial regions were similar.
(a) Excluding the age effect, the 3D-FD values of 32 cerebral regions had significant negative correlations with disease duration. (b) No significant difference was observed among these individual regions using ANOVA with Bonferroni post-hoc analysis (Degrees of freedom for regions = 98 and F = 0.02).

