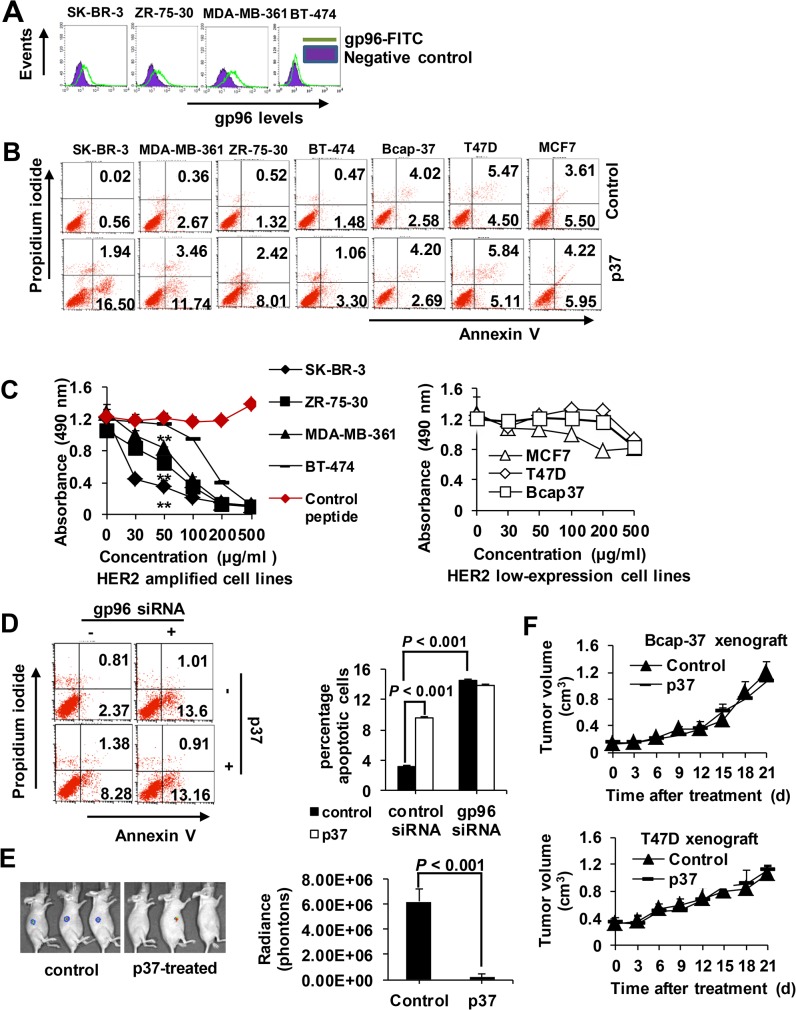
Fig 3. p37 peptide suppresses cell growth and induces apoptosis in breast cell lines.
(A) Flow cytometric analysis of cell surface gp96 levels in breast cancer cells. (B) Cells were treated with 50 μg/ml of p37 for 48 h. Cellular apoptosis were analyzed by FACS, and the percentage of apoptotic cells (Annexin V single positive and Annexin V/PI double positive) was determined. (C) CCK-8 assay of cell proliferation upon treatment with various concentrations of p37 peptide for 48 h. Results are presented as means ± SD from three independent experiments. (D) SK-BR-3 cells were transfected with gp96 or control siRNA for 48 h. Cells were treated with 20 μg/ml of p37 or control peptide for additional 48 h. Cellular apoptosis were analyzed by FACS. Results are presented as means ± SD from three independent experiments. (E) Representative in vivo luciferase images of SK-BR-3 xenograft nude mice at day 21 after p37 (8 mg/kg) treatment. (F) T47D and Bcap-37 xenograft tumor volume in response to p37 (8 mg/kg) treatment. Data shown are the means and SDs of five mice. Data are representative of two independent experiments. **, P < 0.01 compared with controls.

