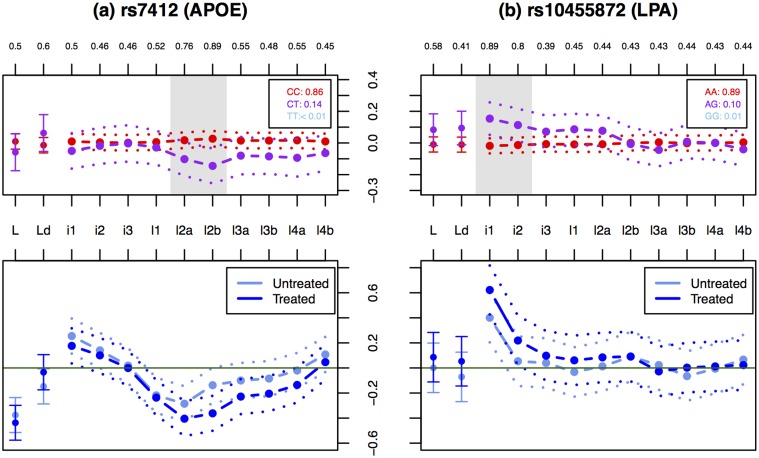
Fig 4. Effects of associated SNPs (rs7412 in APOE and rs10455872 in LPA) on treated and untreated measures of LDL subfractions, and on their difference.
Upper panels show the effects of the SNPs on the difference between treated and untreated measures of LDL subfractions. Labels and colors are as in Fig 2. Lower panels show estimated effect size (dashed lines) and ±2 standard errors (dotted lines) in the treated and untreated (normalized) phenotype for each subfraction.

