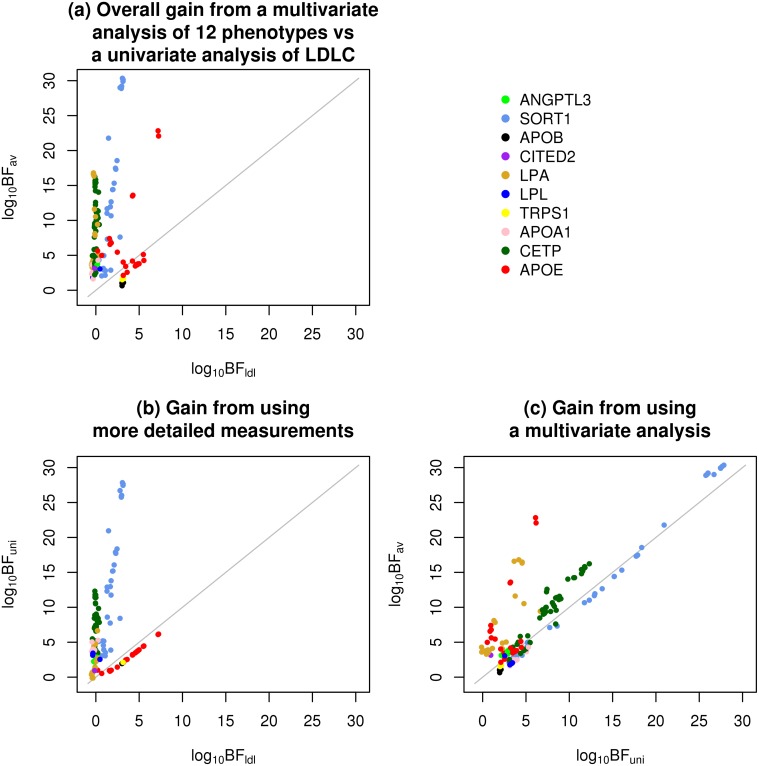
Fig 5. Decomposition of the gain (or loss) from a multivariate analysis of 12 phenotypes vs a univariate analysis of LDL-C into two components: one from using more detailed measurements, and one from using a multivariate analysis.
Plotted are (a) log10 BFav (the BF based on multivariate analysis of all 12 phenotypes) vs log10 BFldl (the BF based on univariate analysis of LDL-C), (b) log10 BFuni (the BF based on univariate analysis of all 12 phenotypes) vs log10 BFldl, and (c) log10 BFav vs log10 BFuni. SNPs are colored according to the nearest gene.

