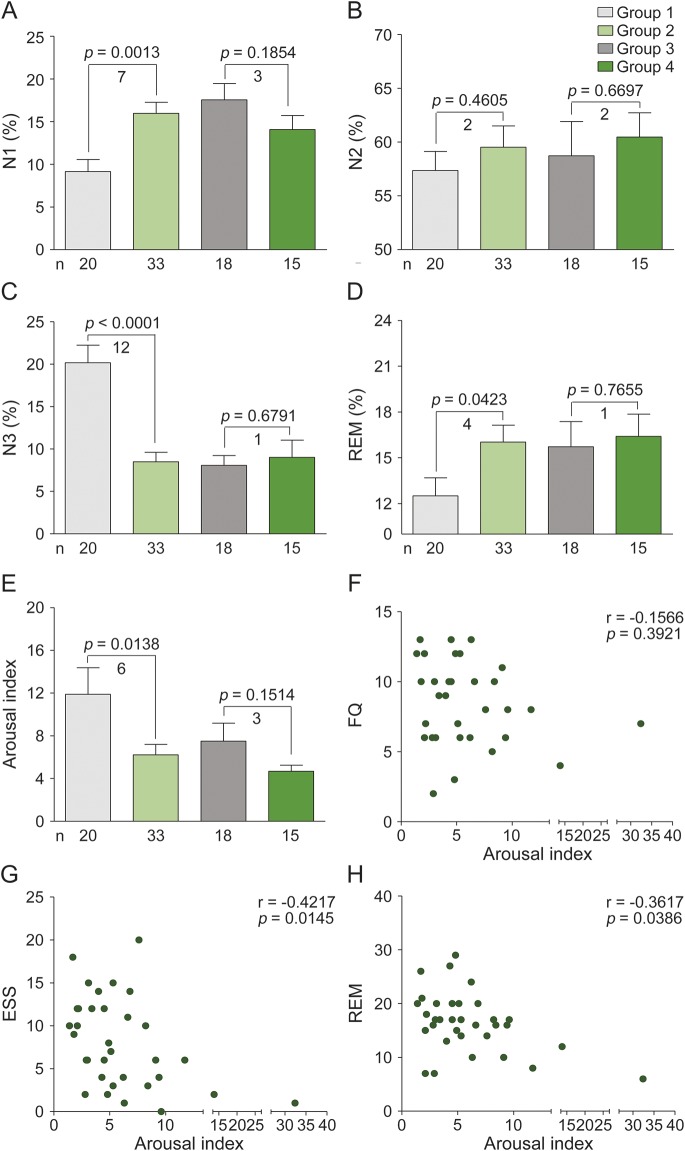
Figure 2. Comparison of sleep stages by groups and correlation analysis.
Graphs show the percentage of time patients spent in each sleep stage: non-REM sleep stages N1 (A), N2 (B), and N3 (C), and REM sleep stage (D). (E) Arousal index: the average number of arousals in a 1-hour period. (F) Epworth Sleepiness Scale (ESS). (G) Fatigue Questionnaire (FQ). Groups 1–4 are those cited in figure 1. (A–E) Comparison of sleep stages and arousal index by group. (F–H) Arousal index with FQ, ESS, and REM% correlation analyses. N1, N2, N3, and REM were tested by analysis of variance accompanied by Bonferroni post hoc tests, and Spearman correlation tests were used to examine associations among arousal index, FQ, ESS, and REM. Statistical significance is defined as p < 0.05.

