
Figure 2.
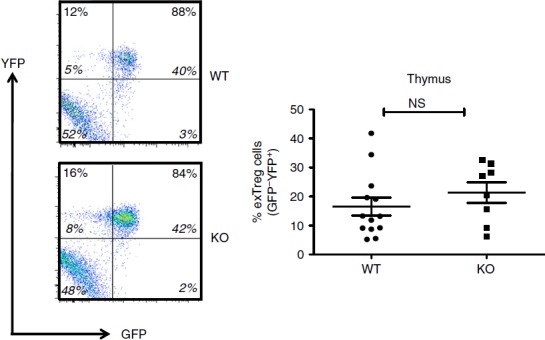
Regulatory T (Treg) cell stability in the thymus of Bcl6−/− mice. Data from the thymuses of Bcl6+/+ (wild-type; WT) and Bcl6−/− (knockout; KO) Foxp3-GFP-Cre-Rosa-YFP (FCRY) mice, with representative flow plots on left and graphed data on right. Thymocytes were gated for surface Treg markers (CD4+ CD25+) before GFP versus YFP analysis. The % of exTreg cells is calculated by the % GFP− YFP+ cells within the total YFP+ population. The numbers in large bold font in upper left and upper right quadrants are % of exTreg cells and % stable Treg cells within the YFP+ population, and these percentages add up to 100%. The smaller numbers in italic font are the % of cells for each of the four quadrants and all four of these numbers add up to 100%. Graphs show average exTreg cells ± SE, with n = 8 to n = 12 mice of each genotype. Data from four separate experiments were combined into each graph. Each symbol represents one mouse. Student's t-tests were used to calculate statistical significance and P-values. NS, not significant (P > 0·05).