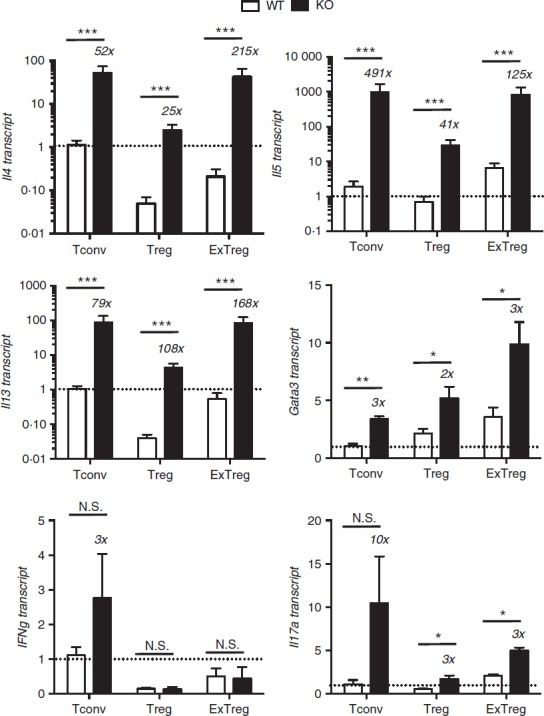
Figure 4.

Cytokine gene expression in Bcl6−/− regulatory T (Treg) and exTreg cells. CD4+ CD25− conventional T (Tconv) cells and CD4+ CD25+ cells from Bcl6+/+ (wild-type; WT) and Bcl6−/− (knockout; KO) FCRY mice were obtained by magnetic bead selection. CD4+ CD25+ cells were further separated into Treg cells (GFP+ YFP+) and exTreg cells (GFP− YFP+) by cell sorting. Isolated cells were stimulated 16 hr with anti-CD3 and anti-CD28 antibodies before harvest for RNA isolation. Gene expression was assessed by quantitative PCR. Data shown are representative of two different experiments. Graphs show relative gene expression, and bars are average fold ± SE and wild-type Tconv cells set as 1. n = 3 to n = 5 of each genotype. Numbers on top of bars indicate fold-increase of KO to WT. Student's t-tests were used to calculate statistical significance and P-values. NS, not significant (P > 0·05), *P < 0·05, **P < 0·01, ***P < 0·001.
