Figure 7.

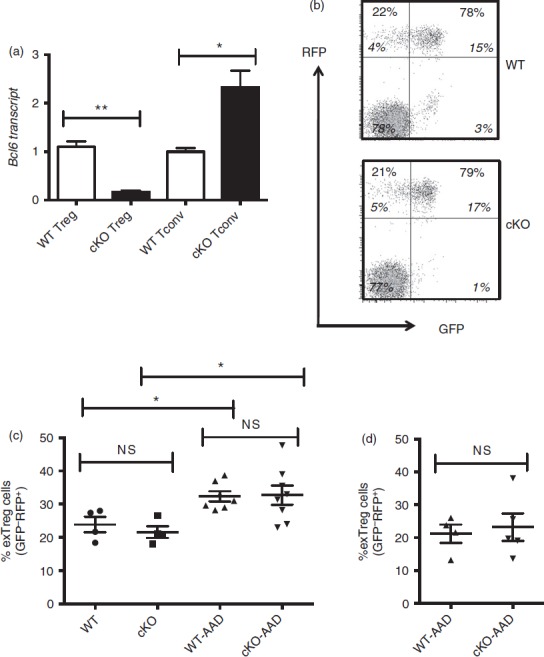
Regulatory T (Treg) stability in Treg-specific conditional Bcl6−/− mice. (a) Quantitative PCR analysis of Bcl6 transcript between Treg-specific conditional Bcl6−/− (Bcl6Foxp3−/−) (conditional knockout; cKO) mice and control Bcl6+/+ (Bcl6Foxp3+/+) (wild-type; WT) mice. CD4+ CD25+ FoxP3+ (Treg) and CD4+ CD25− (conventional T; Tconv) cells were prepared by MACS separation and FACS isolation, then activated for 16 hr with anti-CD3 and anti-CD28 before RNA and cDNA preparation. Relative gene expression is shown, where Bcl6 expression is normalized to tubb5. Data are average expression ± SE from three WT and six cKO mice. The increase in Bcl6 mRNA expression in cKO Tconv cells probably relates to an increase in Bcl6-expressing follicular helper T cells in these mice (unpublished data). (b) Data from the spleens of Treg-specific conditional Bcl6−/− (Bcl6Foxp3−/−) (cKO) mice and control Bcl6+/+ (Bcl6Foxp3+/+) (WT) mice, mated to a Foxp3-GFP-Cre-Rosa26-RFP (FCRR) background. Representative flow plots of splenocytes gated for CD4+ expression before GFP versus RFP analysis. RFP was used instead of YFP for these mice, but the gating pattern for Treg and exTreg cells is otherwise the same as for FCRY mice. The numbers in large bold font in upper left and upper right quadrants are % of exTreg cells and % of stable Treg cells within the RFP+ population, and these percentages add up to 100%. The smaller numbers in italic font are the % of cells for each of the four quadrants and all four of these numbers add up to 100%. The % of exTreg cells is calculated by the % GFP− RFP+ cells divided by the total RFP+ population. (c) ExTreg percentages in the steady state (WT and cKO) or after induction of allergic airway inflammation [WT-AAD and cKO-AAD; allergic airway disease (AAD)]. Cells shown are gated on total CD4+ T cells. (d) Percentages of exTreg cells after induction of allergic airway inflammation (WT-AAD and cKO-AAD). Cells shown are gated on CD4+ CD25+ T cells. Graphs show average ± SE, with n = 4 to n = 7 mice of each type. Data are shown is representative of two different experiments. Each symbol represents one mouse. Analysis of variance was used to calculate statistical significance and P-values. NS, not significant (P > 0·05), *P < 0·05, **P < 0·01
