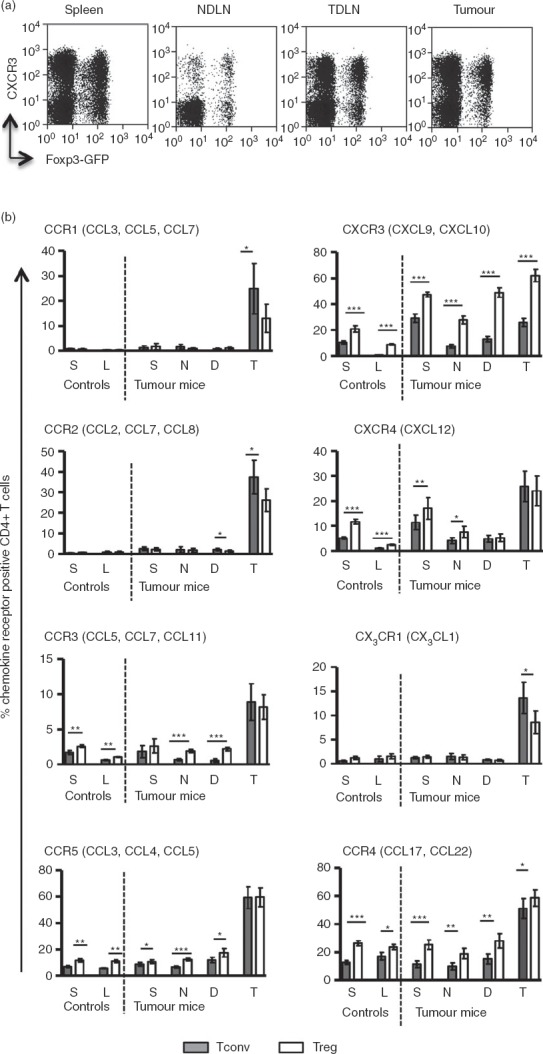
Figure 3.

Analysis of chemokine receptor expression by flow cytometry. Single cell suspensions prepared from tumours, spleens and lymph nodes were stained for various chemokine receptors and analysed by flow cytometry. (a) Representative FACS plots showing expression of CXCR3 on conventional T (Tconv) and regulatory T (Treg) cells. (b) Frequency of CD4+ T cells expressing chemokine receptors in control (non-tumour-bearing) and tumour bearing mice. Shaded and clear bars represent Tconv and Treg cells, respectively. Letters S, L, N, D and T denote spleen, lymph node, non-draining lymph nodes (NDLN), tumour-draining lymph nodes (TDLN) and tumour, respectively. Paired t-test was used for statistical analysis. P-value interpretation: ***P ≤ 0·0009; **P = 0·001 to P = 0·009; *P = 0·01 to P = –0·05. The main chemokines that bind the respective receptors are indicated in brackets.
