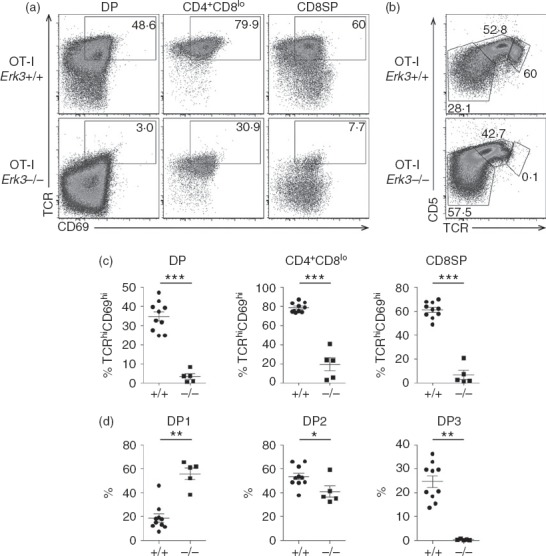
Figure 6.

Impaired positive selection of extracellular signal-regulated kinase 3 (ERK3) -deficient OT-I thymocytes. (a) T-cell receptor (TCR) and CD69 expression is shown for double-positive (DP), CD4+ CD8lo and CD8 single-positive (SP) OT-I Erk3+/+ and Erk3−/− thymocytes. The percentage of TCR+ CD69+ cells is indicated each FACS profile. (b) TCR and CD5 expression on DP thymocytes is shown for OT-I Erk3+/+ and Erk3−/− mice. The percentages of DP1 (TCRlo CD5lo), DP2 (TCRint CD5hi) and DP3 (TCRhi CD5int) thymocytes are indicated on each FACS dot plot. (c) Compilation of the frequency of OT-I Erk3+/+ and Erk3−/− TCRhi CD69+ thymocytes within the different thymocyte subsets. (d) Compilation of the frequency of DP1, DP2 and DP3 thymocytes in OT-I Erk3+/+ and Erk3−/− thymi. The line represents the mean and the error bars are the standard error of the mean (SEM). Each dot represents one individual mouse. The statistical significance was determined with a Mann–Whitney U-test (*P < 0·05; **P < 0·01; ***P < 0·001). The results of four independent experiments are shown.
