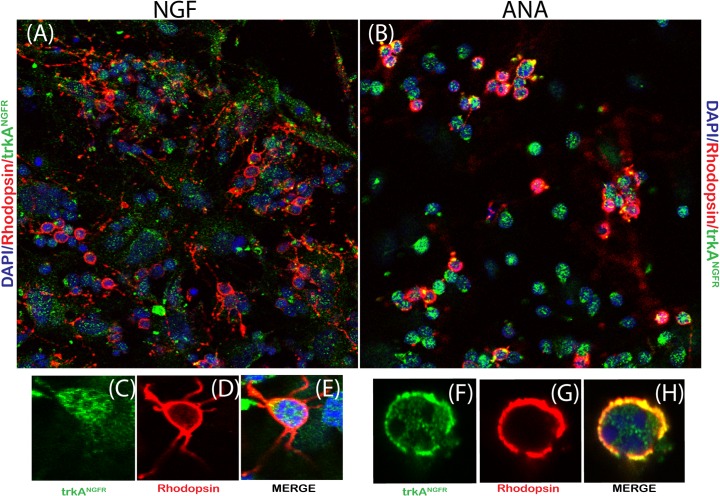
Fig 4. trkANGFR expression in retinal cells.
Representative images of p10 retinal cells exposed to 50ng/mL NGF (A,C-E) or 500ng/ml neutralizing anti-NGF antibodies (B,F-H; ANA) over 6 days. Note the trkANGFR immunoreactivity (green) in Rhodopsin positive (red) cells from cultures exposed to NGF (A) or ANA (B). Single-stainings or merges for NGF (CDE) and ANA (FGH) are shown. (DAPI nuclear staining; Magnifications: A,B: x400; C-H; x600/oil immersion).

