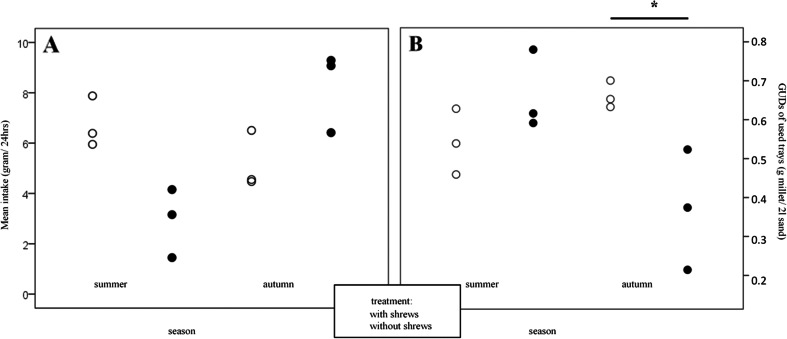
Fig. 2.
a Effect of the season and shrew treatment on bank vole females’ mean intake of food in 24 h. b Effect of season and shrew treatment on the mean giving-up densities (GUDs) of the trays exploited by the animals. Each symbol represents a single-day average for one female from a seed tray grid around her nest. Near and far trays are pooled.*p < 0.05

