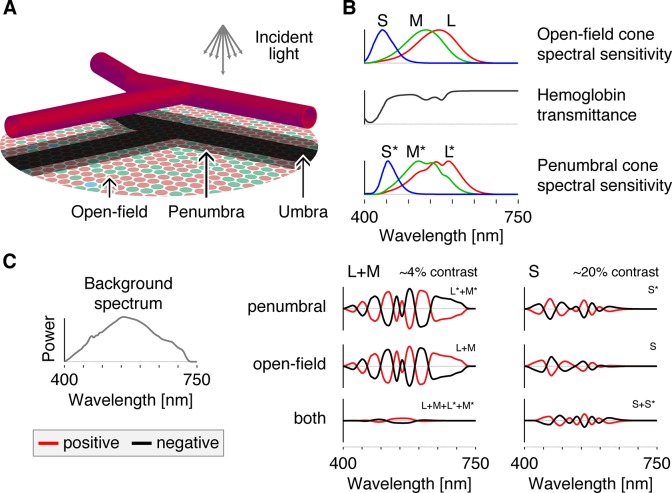
Fig 1. Spectral sensitivities and apparatus.
A: Schematic diagram of the retina showing the shadows cast by the retinal blood vessels lying in front of the photoreceptive layer of the retina. B: The spectral sensitivities of the open-field cones (upper panel) are filtered by the hemoglobin transmittance spectrum (middle panel), resulting in wavelength-specific changes of the cone spectral sensitivities (lower panel). C: All modulations are carried out around a rod-saturating background whose spectrum is shown at the left. On the right are plotted the spectral modulations that target each of the indicated cone class(es), with the targeted class(es) indicated at the upper right of each individual plot. The amplitudes of these modulations are varied sinusoidally in time between the plotted positive (red) and negative (black) modulations and are then added to the background spectrum to produce the stimuli seen by the observer.

