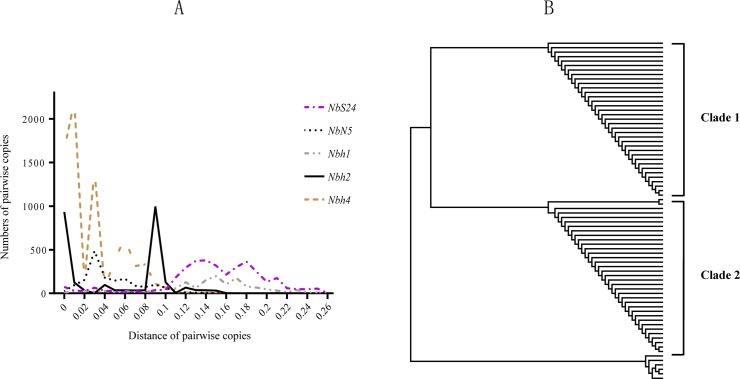
Fig 1. Several rounds of amplifications of MITE families in N. bombycis.
(A) The distribution profile of genetic distance for copies of MITE families. X-axis represents the interval of genetic distance; Y-axis represents the numbers of any pairwise copies. (B) The tree diagram for the copies of Nbh2 families with neighbor-joining (NJ) method.

