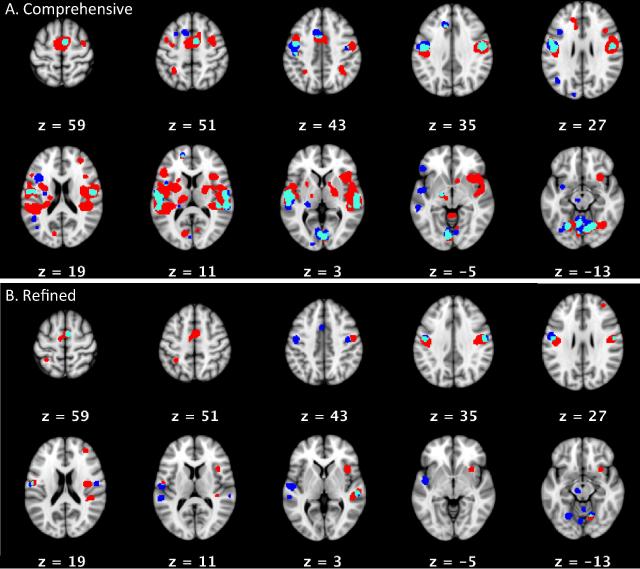
Figure 1. Large-Scale Meta-Analyses, (A) Comprehensive and (B) Refined.
The top section (A) shows areas of consistent activation for PDS (red) and controls (blue) in ‘comprehensive’ within-group meta-analyses, with areas of overlap in aqua (Cf. Supplementary Table 2 for xyz locations and anatomical labels). The bottom section (B) shows areas of consistent activation for PDS (red) and controls (blue) in the ‘refined’ “within-group meta-analyses, with areas of overlap in aqua (cf. Supplementary Table 2 for xyz locations and anatomical labels. All activations are overlaid on MNI152 atlas; slice numbers reference MNI152 space.

