
Fig. 5.
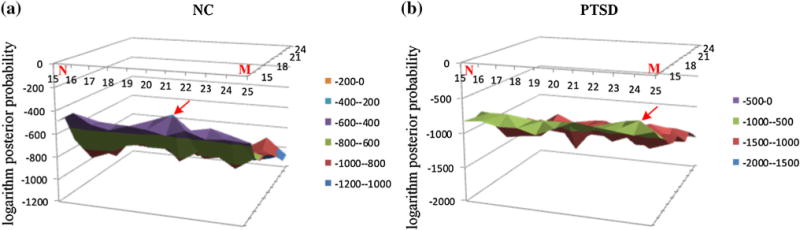
The logarithm likelihood of the multiple observation sequences of NC in a, and PTSD in b. The logarithm likelihood of the multiple observation sequences of NC reaches its local maximum at M of 16 and N of 21, where is highlighted by the red arrow in a, while the one of the multiple observation sequences of PTSD reaches its local maximum at M of 16 and N of 24, where is highlighted by the red arrow in b