
Fig. 6.
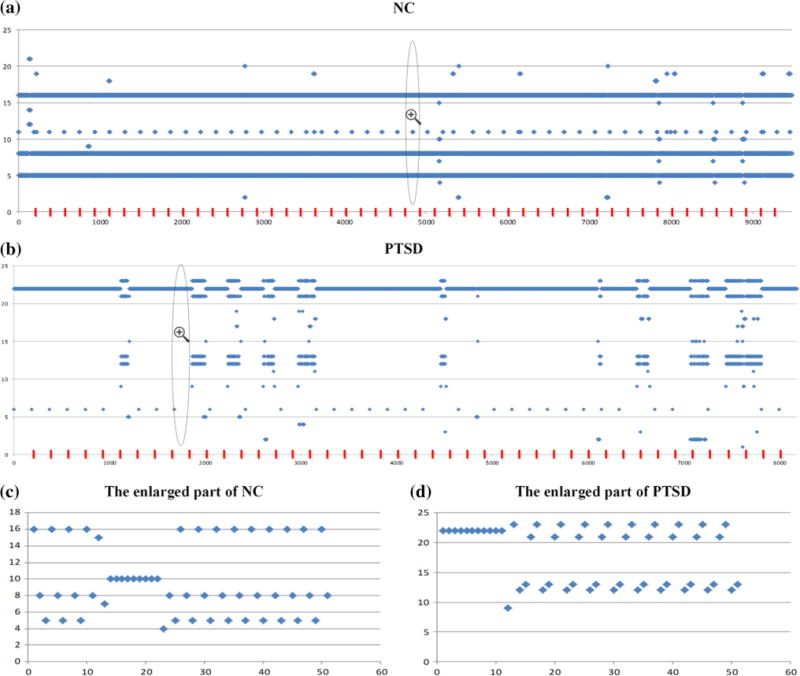
The joint multiple underlying temporally dynamic transition patterns of the FBSs for NC in a, and for PTSD in b, with the quantitative properties of (3, 181.4) and (1, 27.2). The temporally dynamic transition patterns in each area that split by the red line represented the dynamic transition patterns of an individual subject. For better illustration, we enlarged part of the transition patterns of NC in c, and PTSD in d