
Fig. 7.
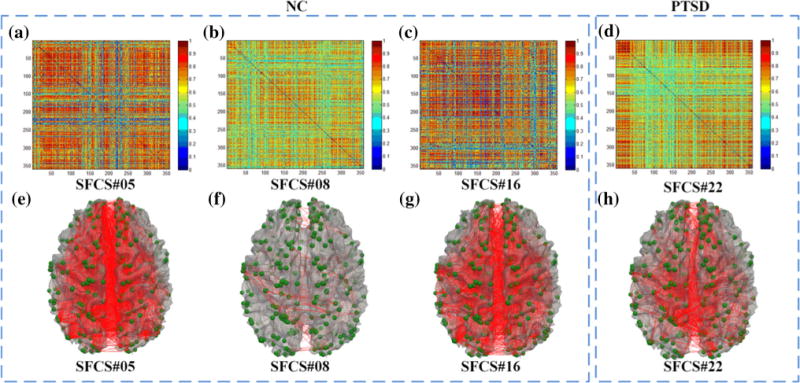
Visualization of the 358 × 358 functional connectome patterns of the 3 most frequent SFCSs of NC in a–c, and the most frequent SFCS of PTSD in d, and visualization of the functional connectome patterns of the above 4 most frequent SFCSs on cortical surfaces in e–h. DICCCOL ROIs are marked as green spheres on the cortical surface, and the functional connectivities between ROIs are shown as red edges connecting those spheres