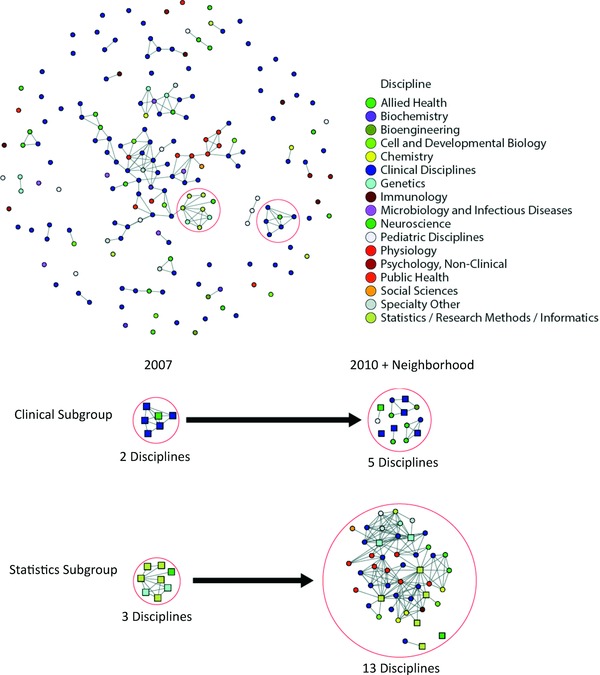
Figure 3.

Evolution in grant cosubmissions from 2007 to 2010. Main graph represents 2007 grant network with two subgroups highlighted. Evolution in subgroup composition demonstrated in 2010 + Neighborhood insert with original 2007 nodes represented as squares.
