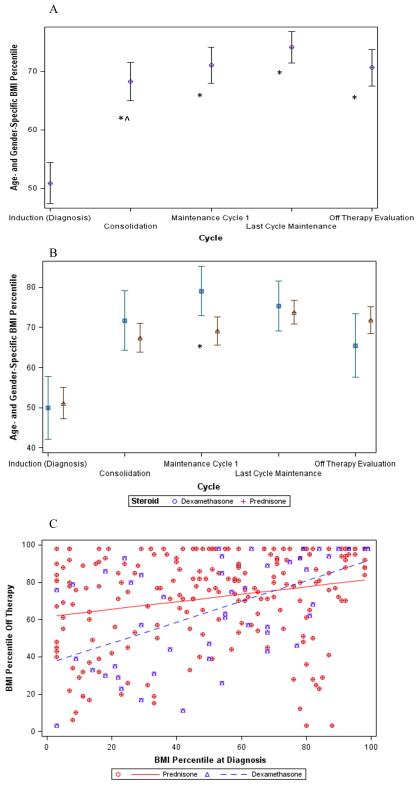
Figure 1.
BMI Percentile During and After Treatment: (A) Unadjusted BMI% trend for the entire cohort; * denotes p<0.05 when compared to diagnosis, ^ denotes p<0.05 when compared to the previous time point; (B) Corticosteroid comparison for the cohort; * denotes p<0.01 for the specified time point; (C) Interaction between BMI% at diagnosis and follow-up by corticosteroid; stronger association in dexamethasone (p<0.05).

