
Figure 19.
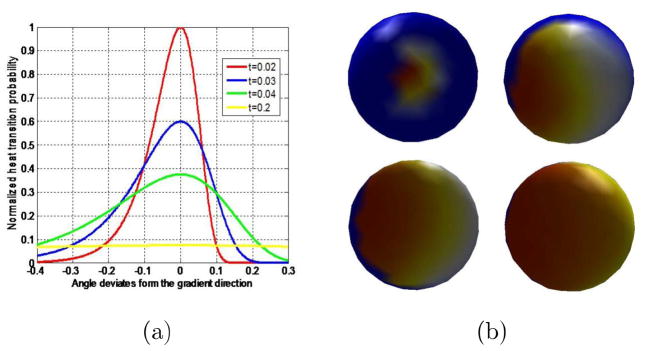
Influence effect of heat transfer time interval. (a) shows the relationships between normalized heat transfer probabilities from the specific point on the higher temperature isosurface (0.95°) to the points on the lower temperature (0.90°) and the angle deviates from the gradient direction. The curves with different colors represent the different heat transfer time intervals. (b) shows the heat acceptance results on the lower temperature isosurface with the different time interval. The top left and right are the time interval of 0.02 and 0.03, the bottom left and right are the time interval of 0.04 and 0.2.