Fig. 5.

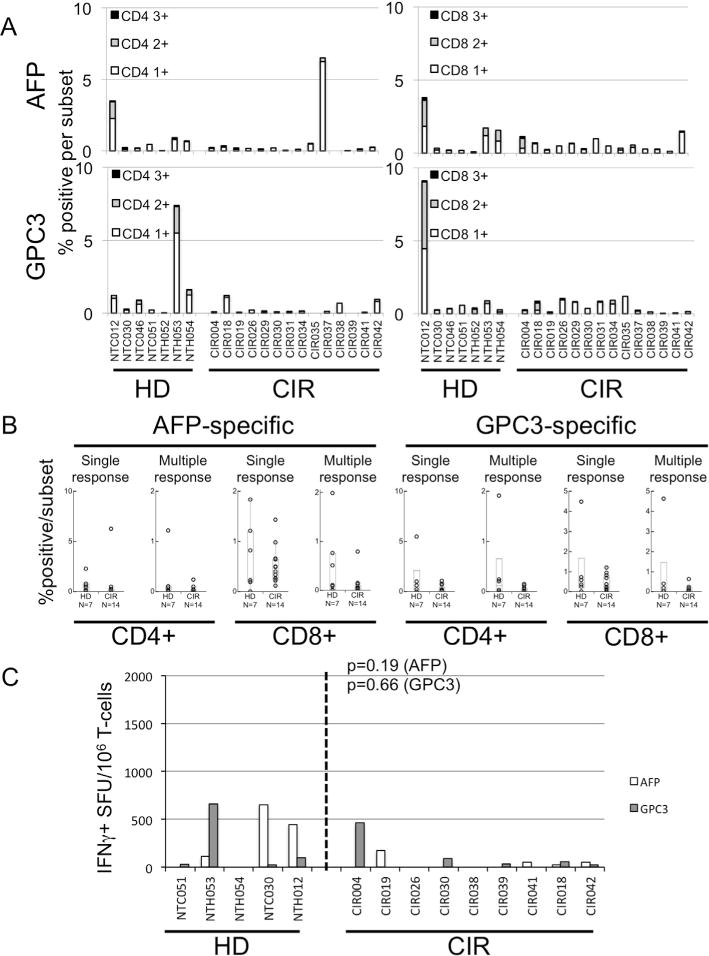
Cytokine and degranulation profile of AFP- or GPC3-peptide in vitro-expanded T-cells. (A) Stacked column chart showing the frequency of cytokine-producting/degranulating CD4+ or CD8+ T-cells after expansion and restimulation with either AFP or GPC3 15mer peptide pools. Black columns represent frequency of T-cells producing TNFα+ and IFNγ+ and staining for CD107a+. Grey columns represent any 2 responses, and white column any single responses. (B) Percentage of MoDC-primed CD4+ or CD8+ T-cells with positive (>0.25%) responses, either single response (producing TNFα+ or IFNγ+ or staining for CD107a+) or multiple response (2 or 3 of above), against AFP or GPC3. (C) Results of AFP- or GPC3-specific IFNγ ELISPOT showing IFNγ SFU per million cells after restimulation of MoDC-primed T-cells. p-Value by Wilcoxon Rank-Sum test.
