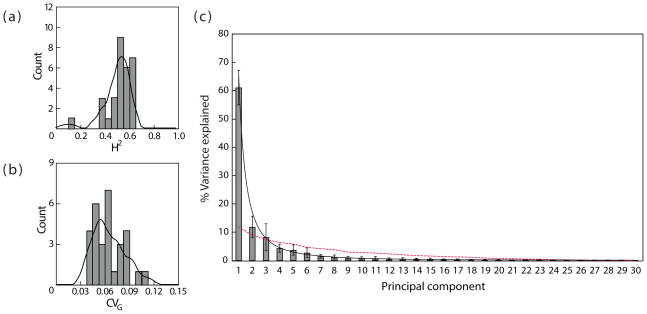
Figure 2.
(a) Frequency histogram of trait-specific broad-sense heritabilities calculated for each of the 30 cranial traits;(b) Frequency histogram of trait-specific genetic coefficients of variation calculated for each of the 30 cranial traits; (c) Percent variance explained by each principal component of the G-matrix. Solid line indicates the best-fit exponential curve. The dashed line indicates the eigenvalue distribution observed once the genetic signal was replaced by random signal (Gnoise).

