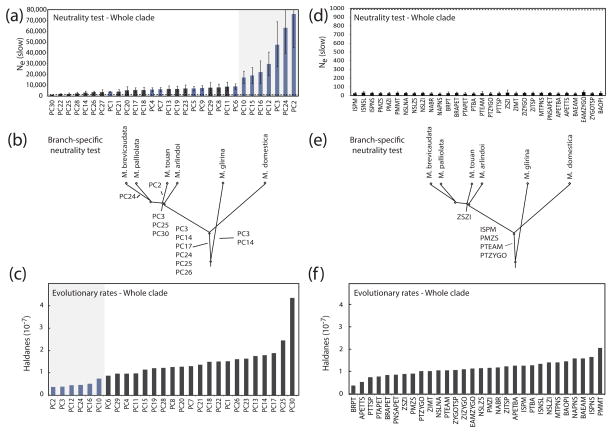
Figure 6.
(a) Critical effective population size (N̂e(slow)) calculated for each PC in the overall tests of neutrality (whole phylogeny). If N̂e(slow)is significantly higher than our assumed Ne, then we reject drift in favor of stabilizing selection. PCs with values of N̂e(slow) significantly higher than 103 are highlighted in blue. Standard deviations for N̂e(slow) are calculated based on the uncertainty in our estimates of VA; (b) PCs under stabilizing selection on each branch of the brevicaudata group’s phylogeny, when using branch-specific tests of neutrality; (c) PC-specific rate of morphological evolution along the brevicaudata group’s phylogeny; (d) N̂e(slow) calculated for each trait in the univariate tests of neutrality. (e) Traits under stabilizing selection on each branch of the brevicaudata group’s phylogeny, when using branch-specific univariate tests of neutrality; (f) Trait-specific rate of morphological evolution along the brevicaudata group’s phylogeny.

