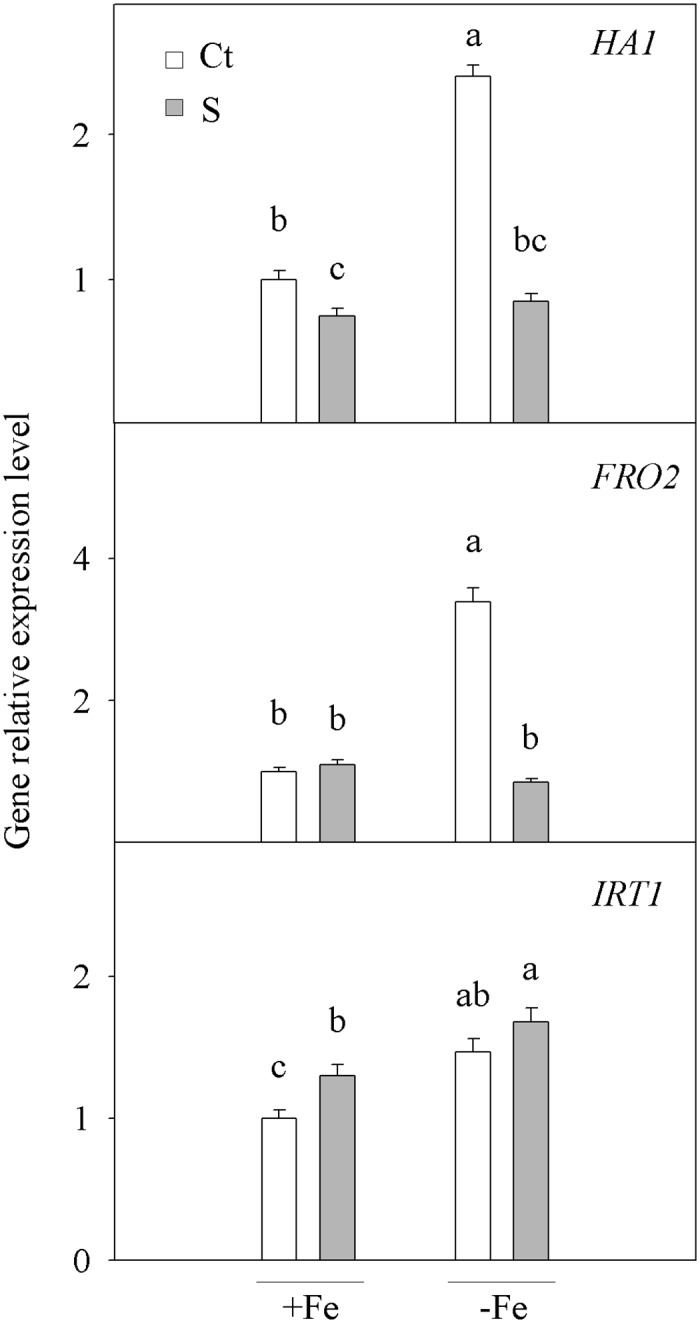
Fig 2. Gene relative expression level.

Relative expression of genes HA1, FRO2 and IRT1 measured by a real-time RT-PCR analysis in the roots of Citrus aurantium seedlings. Plants were grown for 21 days in Fe-sufficient (+Fe) or Fe-deficient (-Fe) nutrient solutions with either the non-stressed (Ct) or the flooding treatment (S). Values are the means of three independent experiments (n = 3). For a comparison of the means, an ANOVA followed by the LSD test, calculated at the 95% confidence level, was performed. Bars with different letters indicate significant differences at *P <0.05 using the LSD multiple range test.
