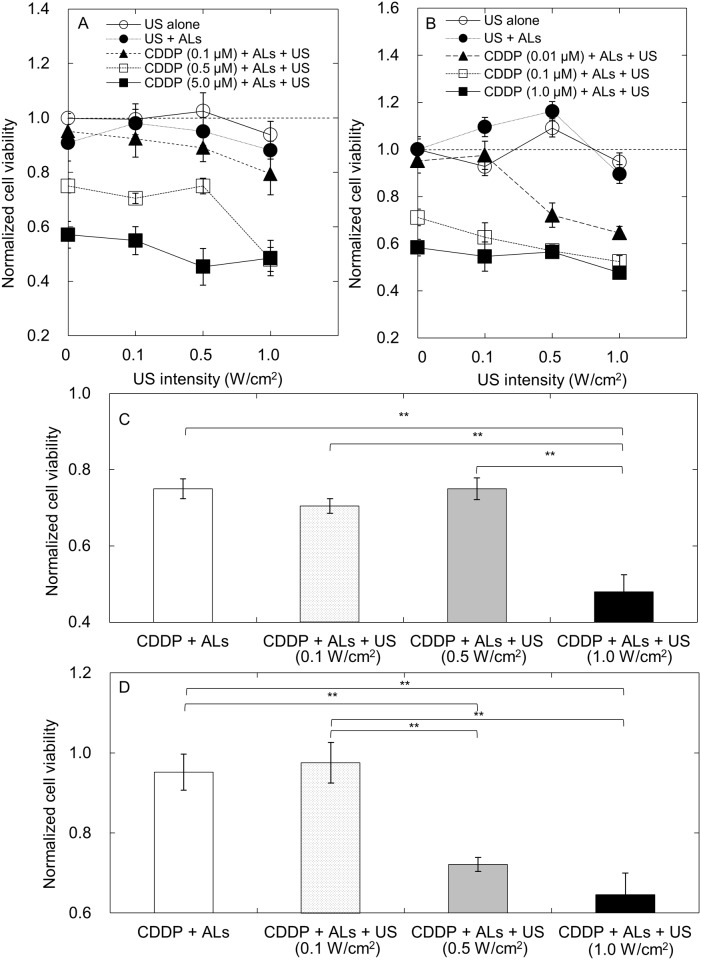
Fig 1. In vitro cell viability.
Normalized cell viability was obtained by dividing the value in each group by the mean value of the control samples (n = 6 for each group). (A) Normalized cell viability of FM3A cells. (B) Normalized cell viability of MH129F cells. (C) Normalized cell viability of FM3A cells when the level of CDDP was 0.5 μM. A significant difference in normalized cell viability between the CDDP + ALs and CDDP + ALs + US groups was demonstrated only at an US intensity of 1.0 W/cm2. (D) Normalized cell viability of MH129F cells when the concentration of CDDP was 0.01 μM. There was a significant difference in normalized cell viability between the CDDP + ALs and CDDP + ALs + US groups at US intensities of 0.5 and 1.0 W/cm2. Mean ± SEM values are shown. **P < 0.01.

