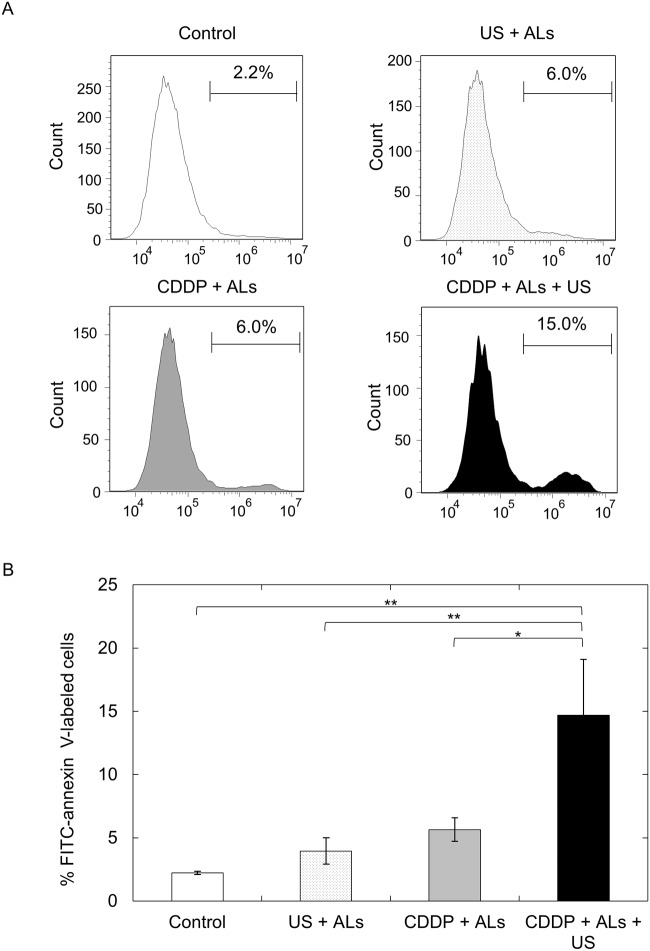
Fig 3. Quantification of apoptosis.
(A) Flow cytometric analysis of FITC-annexin V-labeled FM3A cells. The percentage of FM3A cells labeled with FITC-annexin V is shown. The abscissa indicates the FITC fluorescence intensity (arbitrary units). (B) The percentage of FITC-annexin V-labeled FM3A cells in each experimental group (n = 6). The number of FITC-annexin V-labeled cells in the CDDP + ALs + US group was significantly higher than that in the control (P < 0.01), US + ALs (P < 0.01) and CDDP + ALs (P < 0.05) groups. Mean ± SEM values are shown. *P < 0.05; **P < 0.01.

