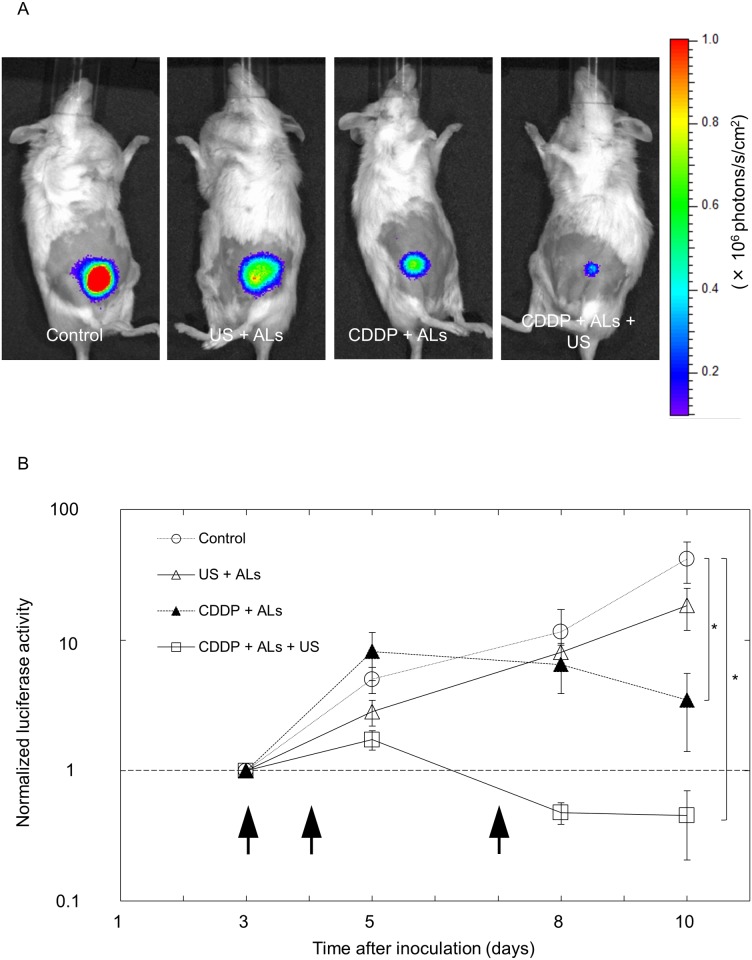
Fig 4. Evaluation of the treatment efficacy of delivery of CDDP with ALs and US.
(A) In vivo bioluminescence imaging on day 10. (B) Longitudinal analysis of normalized luciferase activity (n = 4 for each group). Values at different time points were normalized to those on day 3. Black arrows indicate the days on which treatment was administered (days 3, 4 and 7). On day 10, normalized luciferase activity in the CDDP + ALs + US group was significantly lower than that in the control group (P < 0.05) and showed a trend towards being lower than that in the US + ALs or CDDP + ALs group. Mean ± SEM values are shown. *P < 0.05.

