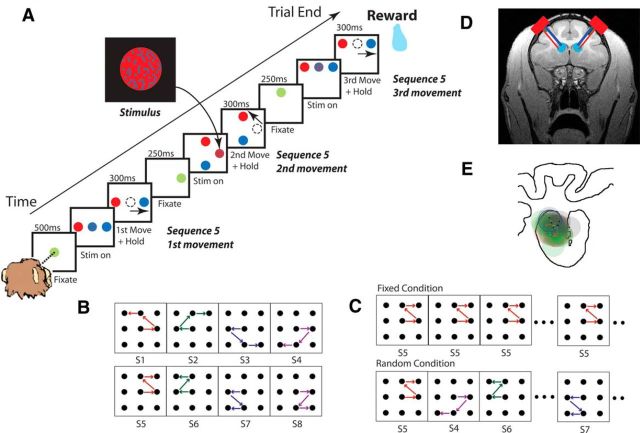
Figure 1.
Task. A, Events in a single trial. The beginning of a new trial was indicated by a green dot at the center of the initial fixation frame. A stimulus with blue and red pixels indicated the correct decision to the peripheral target matching the dominant color of the stimulus. The inset shows an example of a single frame from the stimulus. B, A monkey was trained to execute eight possible sequences of saccadic eye movements. Each movement occurred in at least two sequences. S1, S2, etc., indicate sequence 1, sequence 2, etc. C, In the fixed condition (top), the sequence of eye movements was fixed for eight correct trials and then switched to a new sequence and remained fixed again. In the random condition (bottom), the sequence changed every trial. D, MRI of the anterior portion of the macaque brain with approximate bilateral injection areas. The red squares indicate the location of the chambers. Blue, green, and red lines indicate injection cannulae, electrodes in PFC, and electrodes in dStr, respectively. E, Locations of the injection sites for saline (green dots and circles), the D2R antagonist (red dots and circles), and the D1R antagonist (black dots and circles). The dots show the center points of the four cannulae for each session. The shaded circles show approximate injected areas. Injection locations were symmetric in the two hemispheres, so we only show them for one hemisphere. The coronal section is taken from +29 mm anteroposterior (AP) (center of the chamber was +28 AP, 17 medial-lateral). Four cannulae were used for each hemisphere. For one of the sessions, the locations of the four individual cannulae are shown in blue to show the orientation. The cannulae were spaced by ∼2.5 mm dorsoventral and 2.7 mm mediolateral.

