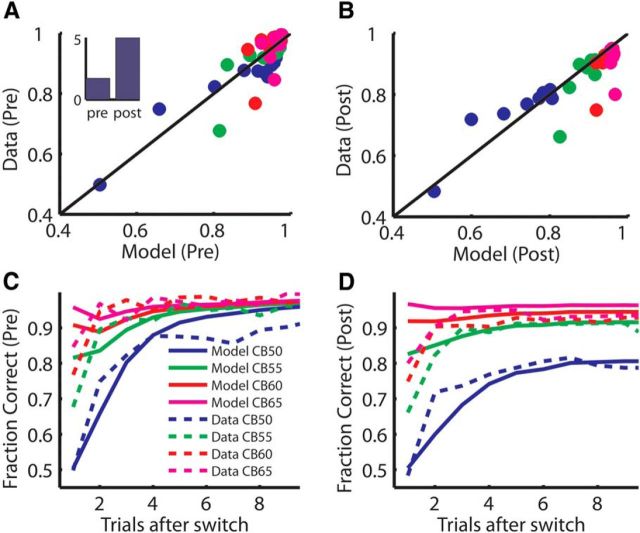
Figure 4.
Behavioral performance and model prediction. Data plotted are observed and predicted fraction corrected across trials after switch. Color indicates the color bias level, as in C. All data are from D2A sessions. Pre–post injections are indicated on the corresponding plots. A, Scatter plot of choice accuracy before injection for the model and data. The inset shows the estimated variance of the noise on value integration. B, Scatter plot of choice accuracy after injection for the model and data. C, D, Same data as plotted in A and B, plotted as a function of trials after switch, broken out by the color bias level.

