Figure 2.
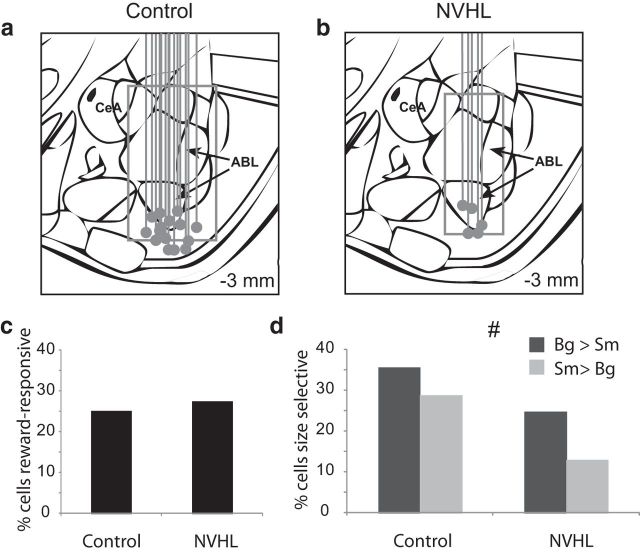
Outcome selectivity in ABL is reduced in NVHL rats. a, b, Recording sites for each rat verified by histology. Gray dot marks the bottom of electrodes. Box represents the extent of the recordings in which single units were collected and considered to be in ABL based on histology and the recording location at which activity was no longer observed. c, The percentage of reward-responsive neurons in ABL (higher firing 1 s after reward compared with baseline; t test; p < 0.05) was not significantly different between control and NVHL rats (χ2). d, Height of each bar indicates the percentage of neurons that showed a significant effect of reward size during the 1 s after reward delivery, #, Indicates main effect of group (NVHL vs control) in the ANOVA (p < 0.05). Bg, big; sm, small; CeA, central amygdala.

