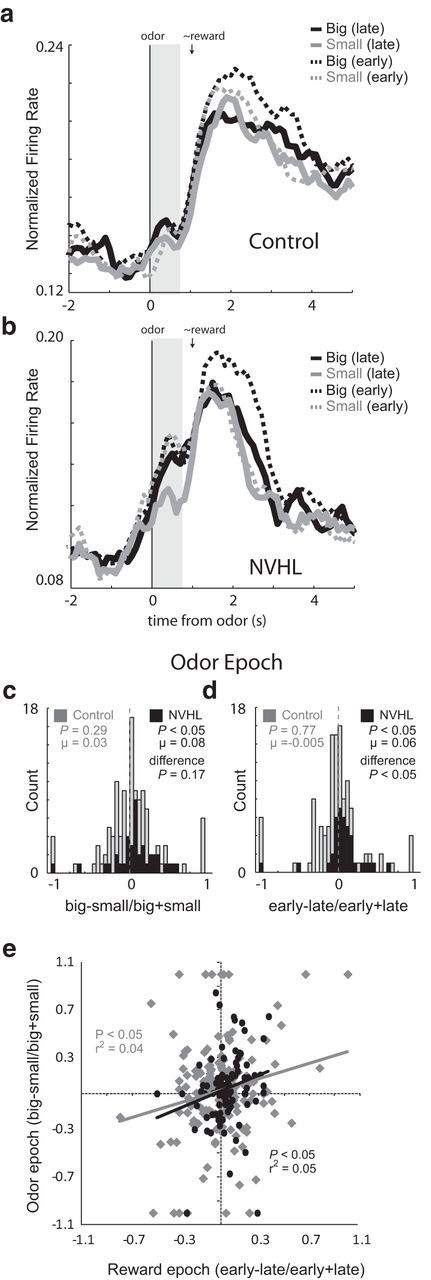
Figure 4.

a, b, Average normalized firing rate for all reward-selective neurons aligned to odor onset for controls (n = 117 cells; 15 rats) and NVHL groups (n = 39 cells; 5 rats). Black, big; gray, small; dashed, first five trials (early); solid, last five trials (late). Vertical gray bar indicates odor epoch used in analysis. c, Distribution plots showing the normalized contrast in activity (large vs small) for each neuron during the odor epoch. The average firing for each trial type over all these neurons is plotted over time for control and NVHL groups in a and b, respectively. d, Distribution plots showing the normalized contrast in activity (early vs late) for each neuron in response to changes in reward contingencies during the odor epoch (odor onset to odor port exit; gray vertical bar). Black and gray represent NVHL and control groups, respectively. e, Correlation between odor selectivity (big − small/big + small) during the odor epoch and changes in firing between early and late trials (early − late/early + late) during the reward epoch for NVHL (black) and control (gray) rats over all recorded neurons. P values represent the significance of Wilcoxon tests used to determine significance of shifts in the distributions from zero and the “difference” between distributions obtained from NVHL (black) and control (gray) rats.
