
Figure 5.
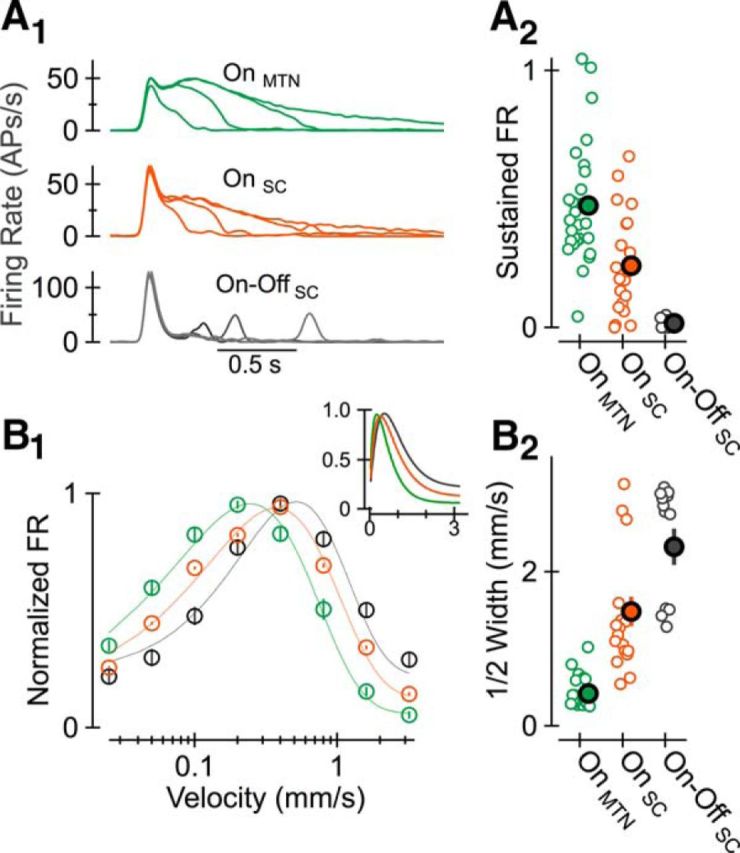
Projection-specific differences in the output of On DS RGCs. A1, Across-cell average of AP responses elicited by a stationary spot presented for four different stimulus durations in MTN-projecting and SC-projecting On DS RGCs and SC-projecting On-Off DS RGCs. A2, Ratio of steady state to peak firing rate for each RGC contributing to averages in A1. B1, Normalized firing rate as a function of stimulus speed (in the preferred direction). Inset shows the same data with a linear, rather than log-based, x-axis. B2, Speed tuning—width at half-max—for each RGC contributing to the average shown in B1. Data from each cell, and populations of like cells, were fit with a gamma function (Nover et al., 2005).