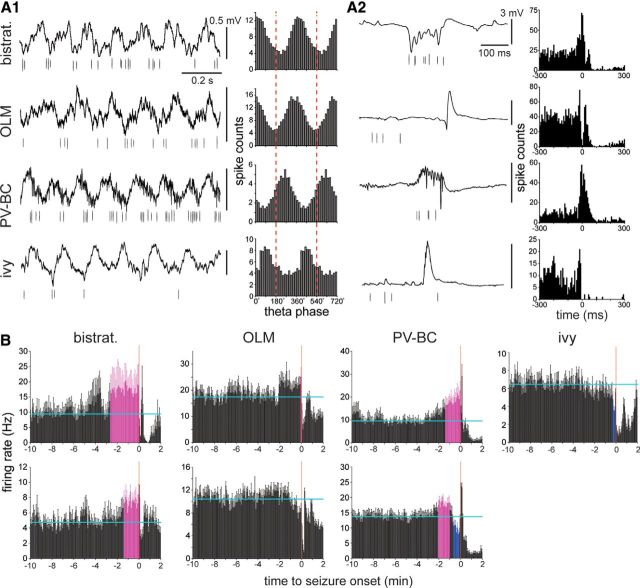
Figure 11.
Preictal activity patterns of putatively identified CA1 interneuron types. A1, A2, Interneuron types were identified based on theta phase preference (A1) and firing characteristics during sharp waves (A2). Putative bistratified (bistrat.), parvalbumin-positive basket cells (PV-BC), OLM cells, and an ivy cell were identified. Traces are local field potentials (top) and unit activity (bottom). A1, In theta-phase plots, red dashed vertical lines indicate positive peaks of the local field potential recorded in stratum oriens or pyramidale. Spike counts from 0° to 360° are duplicated through 720° for ease of viewing. A2, Zero is the peak amplitude of the sharp wave in the histograms. B, Preictal firing rate histograms of two putative bistratified neurons, OLM cells, PV-BCs, and an ivy cell. Cells in the top row correspond to cells in A. Horizontal cyan lines indicate the average baseline firing rate during the 10-5 min period before seizure onset. Error bars indicate SEM. Coloring indicates bars closely approaching seizure onset that are >2 SDs from the baseline average: magenta indicates higher than average, and blue indicates lower than average.

