
Figure 7.
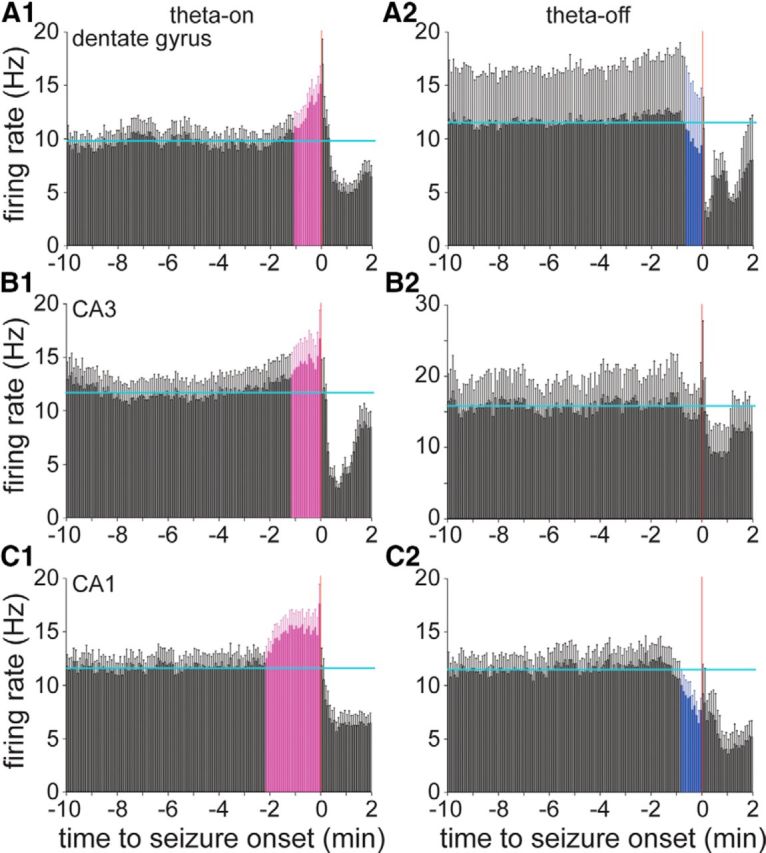
A1–C2, Average preictal activity of dentate gyrus, CA3, and CA1 interneurons classified as theta-on (A1, B1, C1) or theta-off (A2, B2, C2), depending on whether their average firing increased or decreased, respectively, during interictal theta waves. Horizontal cyan lines indicate the average baseline firing rate during the 10–5 min period before seizure onset. Error bars indicate the SEM. Coloring indicates bars beginning immediately before seizure onset that are consistently >2 SDs from the baseline average: magenta indicates higher than average, and blue indicates lower than average. The average firing rates of theta-on interneurons in all regions increased significantly preictally. All subicular interneurons were theta-on (Fig. 5D1). The average firing rates of theta-off interneurons in the dentate gyrus and CA1, but not CA3, decreased significantly before seizure onset. All plots use the same y-axis scale except that in B2.