
Figure 8.
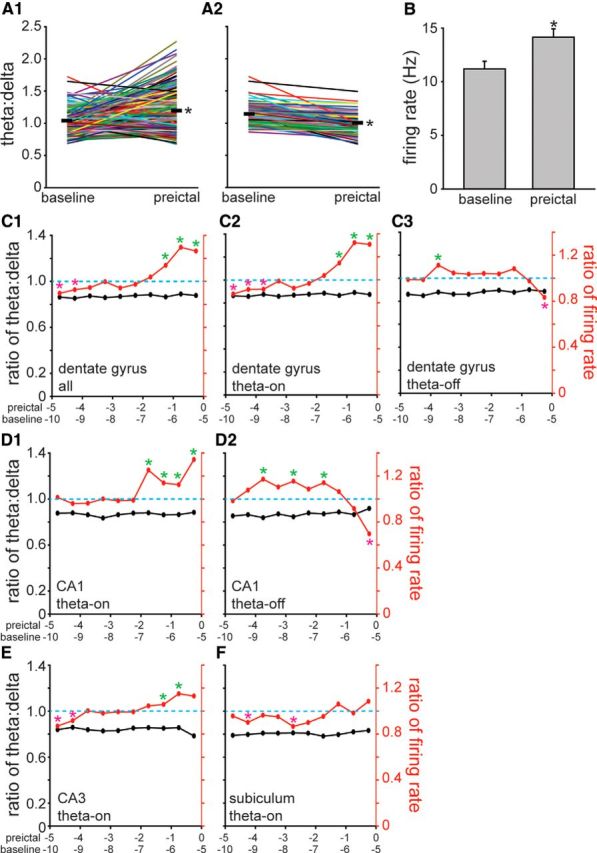
Increased preictal firing of subicular interneurons was theta dependent, but preictal changes in the firing rate of interneurons in other hippocampal regions were at least partly theta independent. A1, Baseline and preictal theta/delta frequency ratios of all seizures during which dentate gyrus interneurons were recorded. Data from individual seizures are indicated by colored lines. Thick, black horizontal lines represent the average theta/delta frequency ratios 5.5–5.0 min (baseline) and 0.5–0 min before seizure onset (preictal). *p < 0.001, paired t test. A2, Seizures in which theta/delta frequency ratios increased from baseline to preictal periods were excluded, leaving only those in which theta/delta frequency ratios were unchanged or decreased preictally. B, Average firing rates of dentate gyrus interneurons 5.5–5.0 min (baseline) and 0.5–0 min before onset (preictal) of seizures without preictal theta (A2). Values represent the mean ± SEM. *p < 0.05, paired t test. C1, Average firing rates of all interneurons recorded in the dentate gyrus (n = 35) increased preictally during seizures without preictal theta activity (p < 0.05, paired t test). The right-most marker in the theta/delta frequency plot was calculated by dividing the average theta/delta frequency ratio during the preictal period by that of the baseline period (values in A2). Similarly, the right-most marker in the firing rate plot was calculated by dividing the preictal by the baseline average firing rate (values in B). The next set of markers to the left in C1 represent values calculated identically, except the baseline period was 6.0–5.5 min and the preictal period was 1.0–0.5 min before seizure onset, and so on. A green (magenta) asterisk indicates significantly higher (lower) average preictal versus baseline firing rates (p < 0.05, paired t test). All average preictal theta/delta frequency ratios were significantly lower than baseline (p < 0.05, paired t test), as expected, because seizures with preictal theta waves were excluded. C2, C3, Average action potential firing rates of theta-on interneurons recorded in the dentate gyrus (n = 31) increased preictally during seizures without preictal theta activity (C2), whereas theta-off interneurons (n = 4) reduced their average firing rate preictally (C3). D1, D2, Theta-on interneurons in CA1 (n = 21) increased their average firing rate preictally without preictal theta (D1), whereas theta-off interneurons in CA1 (n = 9) decreased their average firing rate preictally (D2). E, Theta-on interneurons in CA3 (n = 16) increased their average firing rate before seizure onset without preictal theta. F, In contrast, after excluding seizures with increased preictal theta activity, the average firing rate of subicular interneurons did not change significantly during the preictal period.