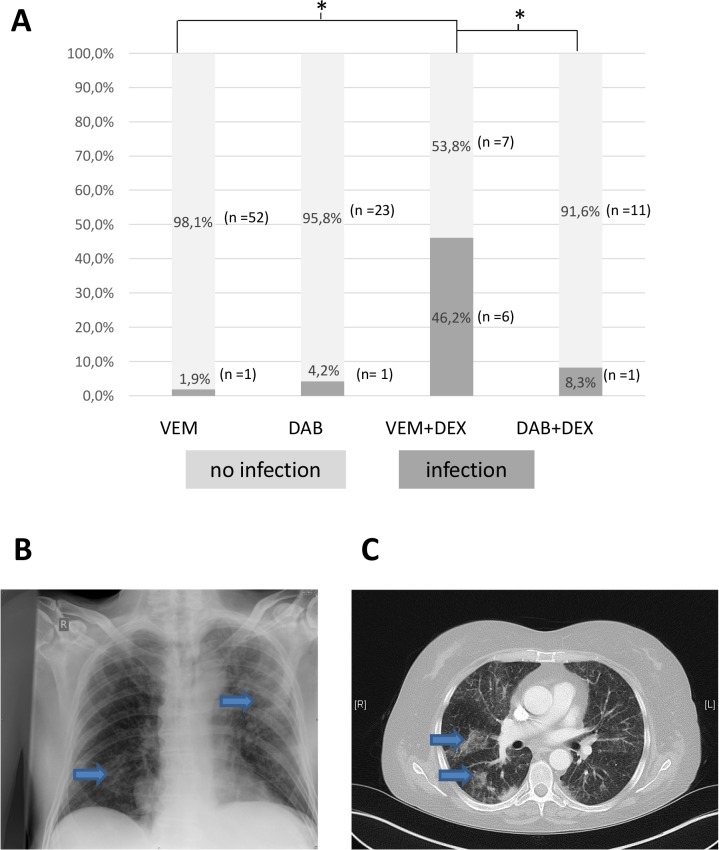
Fig 4. Images of infections occurring under BRAFi and DEX therapy.
(A) The absolute number and percentage of patients developing infections in different treatment groups is shown. (B) Chest x-ray of a patient under therapy with vemurafenib and dexamethasone showing reticular pulmonary infiltrates (blue arrows). (C) CT scan of the thorax of a patient under therapy with vemurafenib and dexamethasone showing atypical pulmonary infiltrates (blue arrows). VEM = vemurafenib; DAB = dabrafenib; DEX = dexamethasone; * = p< 0.05 marking statistically significant difference between groups; n = number of patients.

