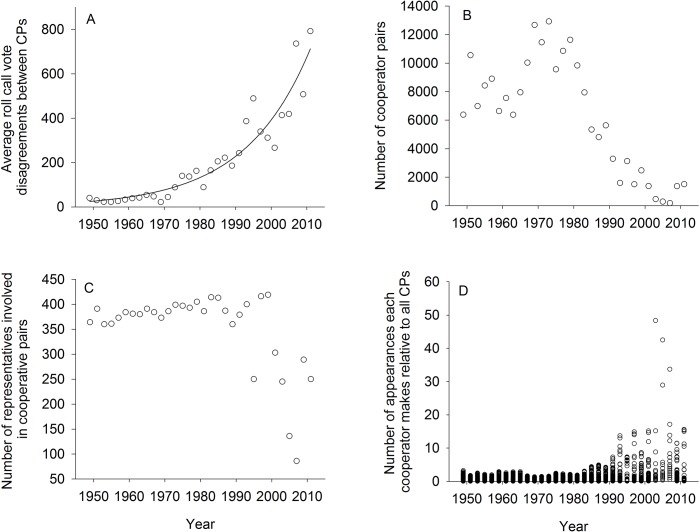
Fig 3. Congressional cooperation rates over time.
Four plots of Congressional non-cooperation through time shown as: (a) Average number of roll call vote disagreements between cross-party (CP) pairs as a function of time. (b) The number of cooperator pairs (e.g. cross-party (CP) pairs who agree more often than a random same-party (SP) pair) as a function of time. (c) The number of representatives involved in at least one cooperator pair as a function of time. (d) The number of appearances each cooperator makes relative to all CPs over time evidences super-cooperators from the late 1990s to the present.

