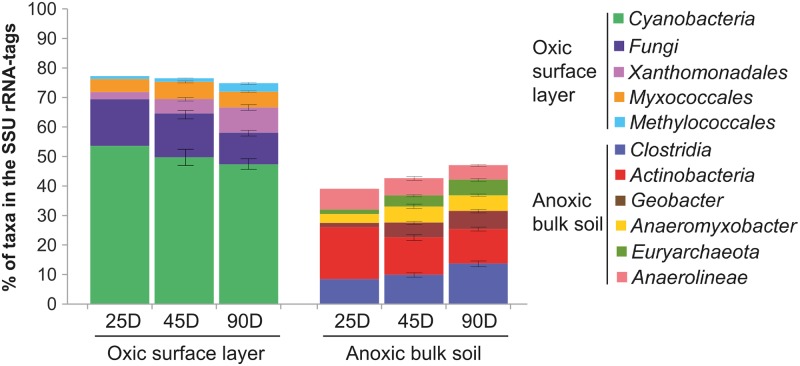
Fig 2. Temporal changes in the relative abundance of the dominant taxonomic groups in the SSU rRNA-tags over incubation period.
Each of the dominant groups persistently contributed > 5% to total SSU rRNA-tags or showed significant fold changes in their relative abundance during incubation, while no other taxonomic group accounted for greater than 3% at order level. The abundance cutoff was applied to the lowest taxonomic rank possible, explaining why the taxonomic ranks vary from genus to phylum levels.

