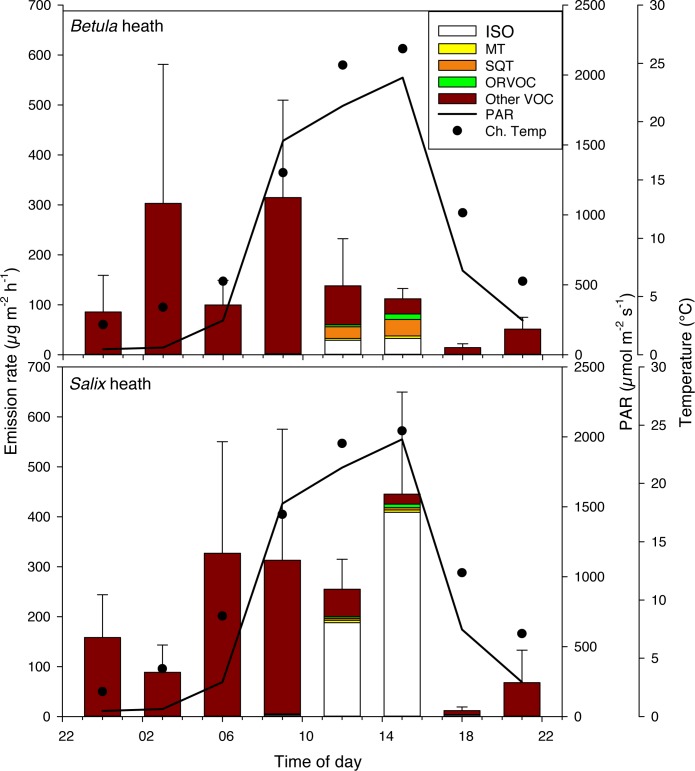
Fig 3. Diel emisisons of BVOCs from Betula nana and Salix glauca-dominated heaths in the Low Arctic, Disko Island.
The stacked bars show mean emission rates (n = 4) of BVOCs during a 24-hour period. Abbreviations for the BVOC groups as in Fig 2. The error bars represent standard error for total emissions. The incoming photosynthetically active radiation (PAR) and chamber temperature (Ch.Temp) during the measurements are shown.

