
Fig 8. WSS Contours across the Idealized Femoral Artery Tree.
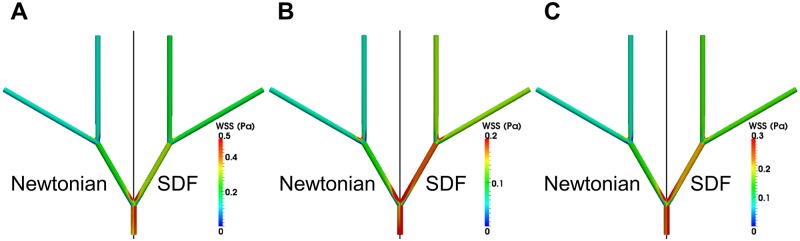
WSS contours at instantaneous time points (A) TA, (B) TB, and (C) TC the idealized femoral artery tree. Due to symmetry, only one half of the idealized femoral artery tree is shown for each model, where the left half is the Newtonian model and the right half is the SDF model, separated across the black line.