
Fig 9. WSS Versus Time Across the Idealized Femoral Artery Tree.
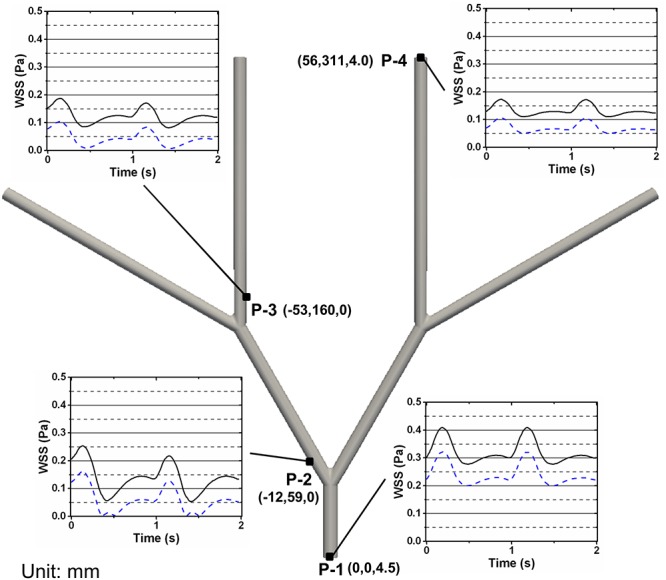
WSS versus time at different spatial locations on the idealized femoral artery tree given by the (x,y,z) coordinates in mm. WSS is shown at the inflow wall (P-1), the wall opposite the first bifurcation (P-2), the wall opposite the second bifurcation (P-3), and the outflow wall (P-4). The solid black line is the SDF WSS and the blue dashed line is the Newtonian WSS.