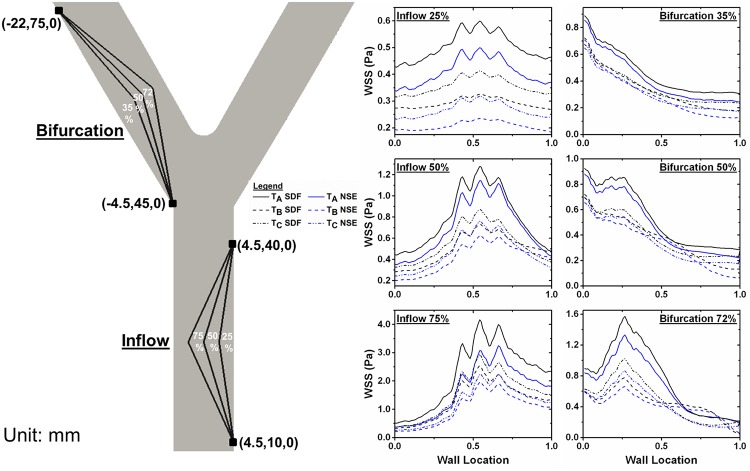
Fig 11. WSS at Varying Degrees of Atherosclerosis.
Atherosclerotic lesions of varying degrees were induced in the idealized femoral artery tree at the inflow artery or at the first bifurcation. The (x,y,z) coordinates in mm show were the atherosclerotic lesion endpoints were prescribed. WSS from the SDF and Newtonian models were extracted along the wall opposite the plaque and plotted at TA, TB, and TC. The x-axis indicates location along the wall, where zero corresponds to the lowest y-coordinate of the plaque and one as the highest y-coordinate.

