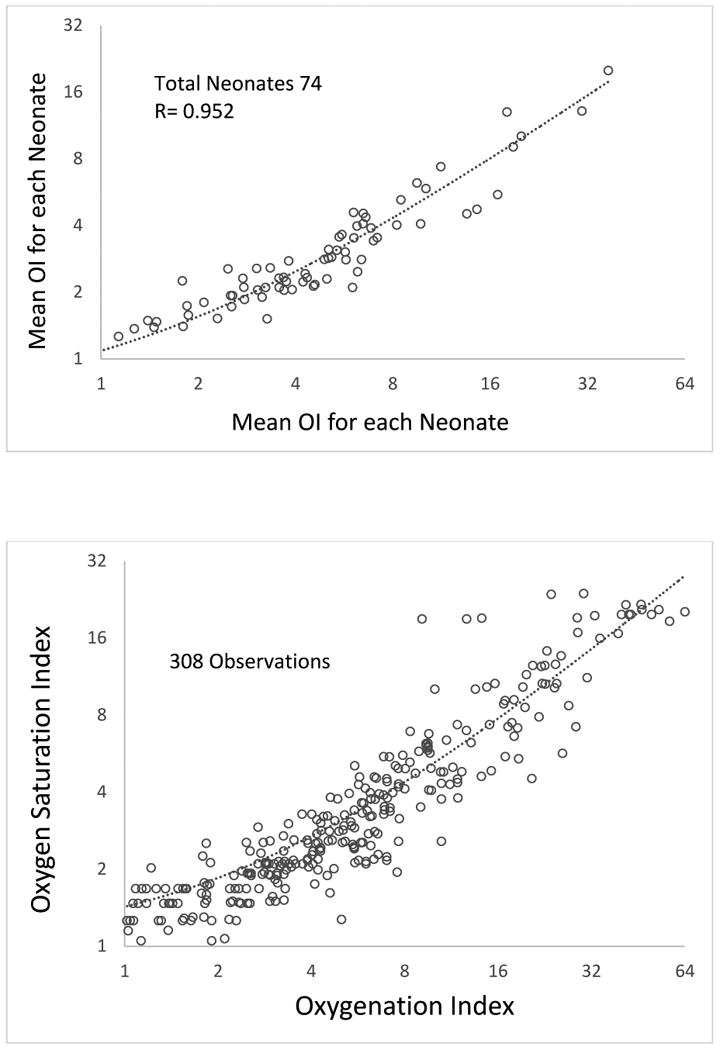
Figure 1.

A. Scatter-plot showing mean OI and mean OSI in late preterm and term neonates with hypoxic respiratory failure during the first 24 hours of age. The axis for OI and OSI are on a logarithmic scale to a base of 2.
B: Scatter-plot showing all observations of OI and OSI in late preterm and term neonates with hypoxic respiratory failure during the first 24 hours of age. The axis for OI and OSI are on a logarithmic scale to a base of 2.
