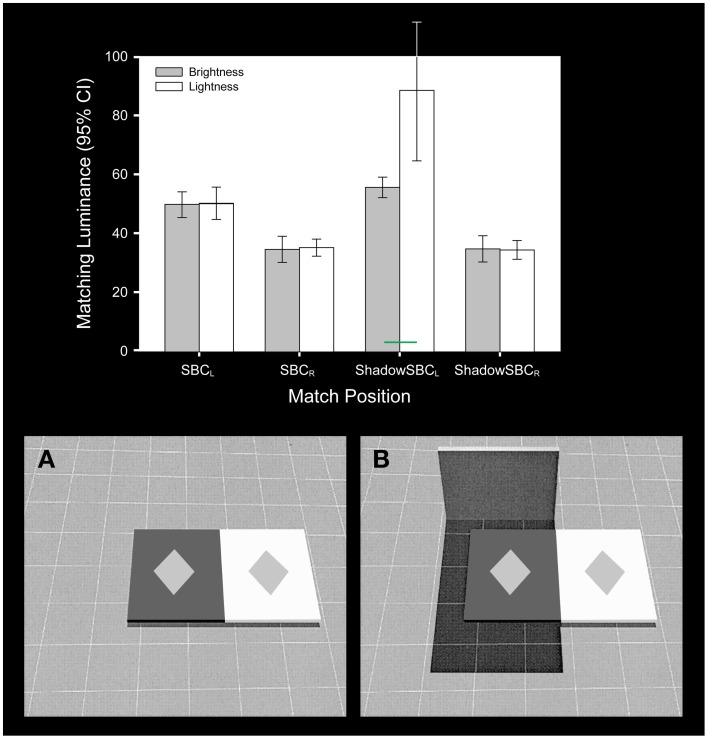
Figure 2.
The simultaneous contrast stimulus used by Blakeslee and McCourt (2012). The stimulus was modeled on the Williams et al. (1998) version of a reflectance edge (A) and an illumination edge (B) simultaneous contrast illusion. In (B) the test patches and near backgrounds are identical to those in (A); however, a dark far surround has been added that causes the left half of the stimulus to appear to be in shadow. The bar graph plots the mean (and 95% confidence intervals) of four observers brightness (gray bars) and lightness (white bars) matches for each test patch within the stimulus displays. The test patches are labeled from left to right in the order that they appear in the stimuli. Lightness matches only differed significantly from brightness matches (green bar) in (B) where the test patch was seen beneath a shadow. Under these conditions subjects were able to make independent inferred judgments of lightness.

