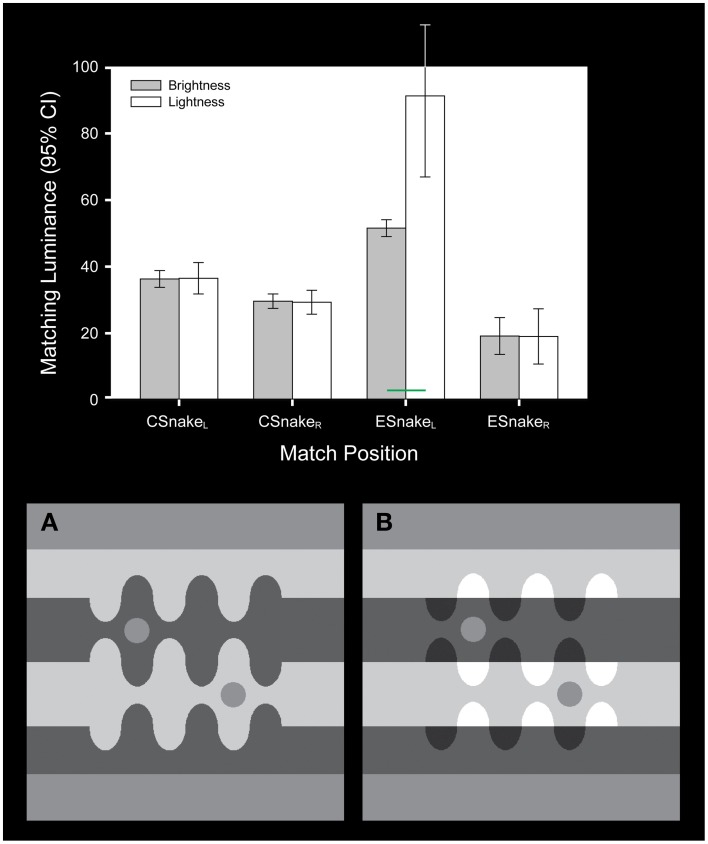
Figure 3.
The snake illusion stimulus used by Blakeslee and McCourt (2012). The stimulus is modeled on Adelson (2000). The test patches in (A, B) share the same luminance. In addition, the upper test patches in both stimuli have the same lower background luminance and the lower test patches share the same higher background luminance. The stimuli differ in the luminances of the more distant regions (the snake undulations) such that the upper test patch in (B) appears to lie beneath a transparent overlay. The bar graph plots the mean (and 95% confidence intervals) of four observers brightness (gray bars) and lightness (white bars) matches for each test patch within the stimulus displays. The test patches are labeled left to right in the order that they appear in the stimuli. Lightness judgments differed significantly from brightness judgments (green bar) only for the upper test patch in (B) where the test patch was seen beneath a transparency. Under this condition subjects were able to make independent inferred judgments of lightness.

