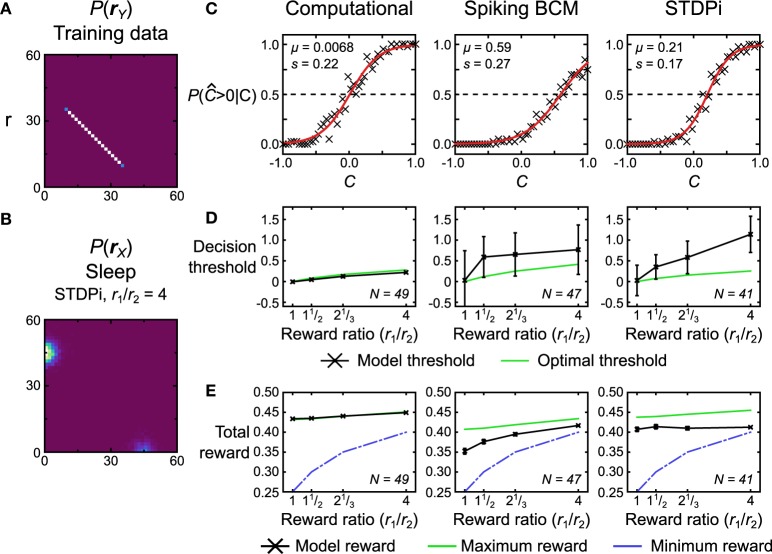
Figure 14.
Performance of the computational and neuronal network models on a reward task. (A) Data set r that the models are trained on for this task. Each data point is labeled with a label C signifying its position on the line. The position ranges along [−1, 1]. The models have to determine whether this position is positive or not, with the two alternative choices being rewarded by different amounts. (B) The bimodal prior for this task encodes the reward ratio r1/r2 of the two alternative choices by modulating the weightings of the two gaussian blobs. The gaussian blob positions and sizes are the same as in Figures 9, 10. Depicted is the prior used for the neuronal networks using the STDPi plasticity rule when r1/r2 = 4. (C) Response probability of three example model instances for r1/r2 = 1. The probability data (crosses) is fit with a logistic function (red line) to determine the model's internal noise and decision threshold. Note that the two neuronal networks show a decision threshold bias. (D) Model decision threshold (black) compared with the optimal threshold (green) given the model noise level (estimated from trials where r1/r2 = 1). Error bars are standard deviation. N is the number of models that were used for a plot. (E) Model attained reward (black) compared with the maximum that an optimal decoder with matched noise level would get (green) and the minimum possible given the scoring procedure (blue). A noiseless optimal decoder would attain a reward of 0.5 across all conditions. Error bars are SEM. N is the number of models that were used for the plotted data points.

