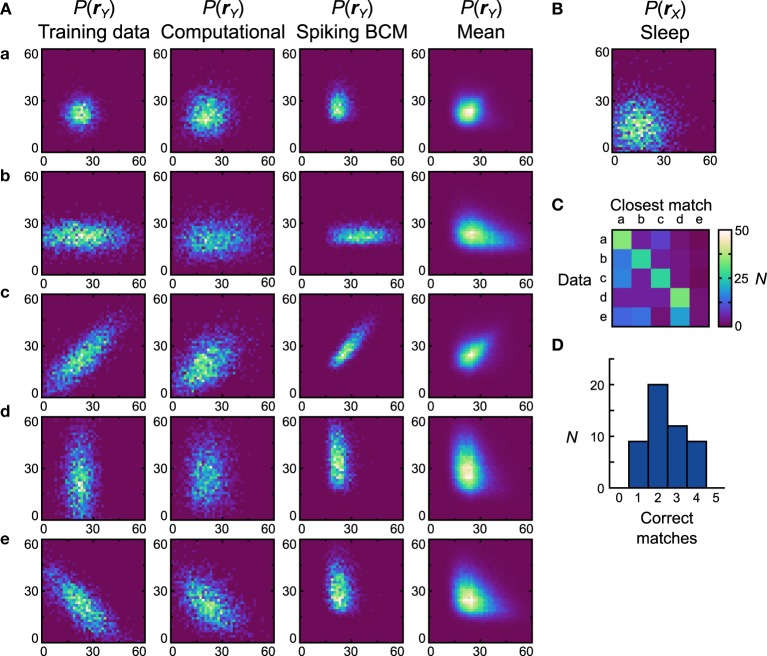
Figure 7.
Performance of the neuronal network implementation of the Helmholtz Machine with the Spiking BCM rule and unimodal data sets. (A) The computational model and 50 instantiations of the neuronal networks were trained on five unimodal data sets shown in the first column. The axes range from 0 to 60 Hz on both components of rY. The resultant generative models from the computational model are shown in the second column. The generative models of the best performing (in terms of matching the training data distributions with the learned generative models) neuronal network are shown in the third column. The fourth column depicts the population means of the generative models of the neuronal networks. (B) Prior distribution used for the generative models. The axes range from 0 to 60 Hz on both components of rX. (C) Confusion matrix obtained by matching the generative models of individual networks with the average (computed across all networks for a given data set) generative distributions. (D) Histogram of the number of correct matches by each neuronal network.

