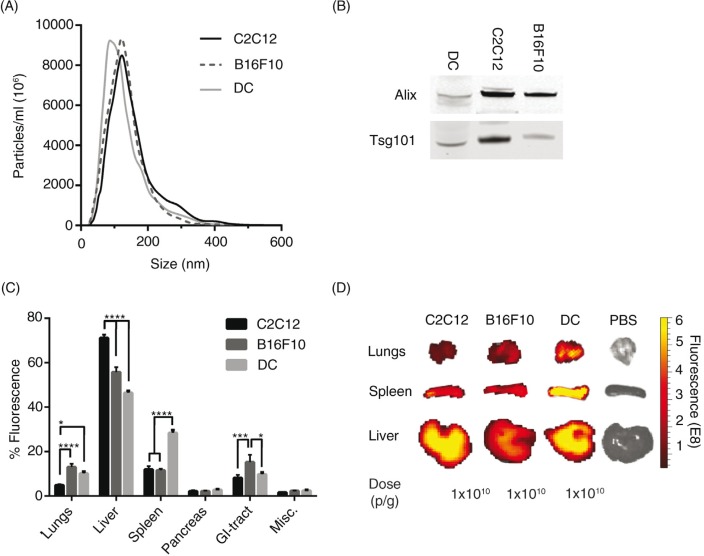
Fig. 4.
The biodistribution of EVs differs between cell sources. (A) Particle distribution of DiR-labelled EVs from mouse C2C12-, B16F10- and DC-cells measured by NTA. (B) Western Blot stained against Alix and Tsg101 of EVs from C2C12-, B16F10- and DC-cells (whole WB-membranes in Supplementary Fig. 7). (C) The percentage of fluorescent signal in each organ after injection of 1.0×10¹⁰ p/g DiR-labelled EVs from the 3 different mouse cell types (Absolute fluorescent signals are plotted in Supplementary Fig. 8). Misc.=brain, heart, kidneys and quadriceps muscle. (D) Representative spleen, liver and lung IVIS images from mice injected with EVs from the 3 different mouse cell sources and PBS-treated control. N=4, in C *represents p=0.05, ***p=0.001 and ****p=0.0001. The results represent mean+SEM.

