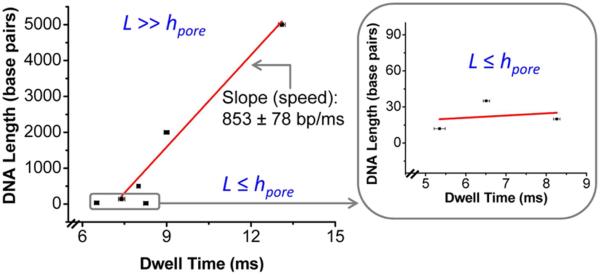
Figure 3. Mean dwell time as a function of dsDNA length.
The mean dwell time for each dsDNA was obtained using an exponential model with density function. Data showing two classes of events for short dsDNA lengths (12, 20 and 35 bp) (boxed) and dsDNA much longer than the length of the connector (141, 500, 2000 and 5000 bp). Slower speed is observed for short length dsDNA (boxed), whereas a constant speed (slope) is observed for longer dsDNA. Applied voltage: -75 mV; error bars represent standard deviation; red line: linear fit.

